A unimodal histogram histogram is a histogram that has only one “peak”, that is the mode is attained at a single value only. The unique value at which the histogram attains a local maximum is the mode of the unimodal histogram.
The shape of a unimodal histogram looks somewhat like the following:
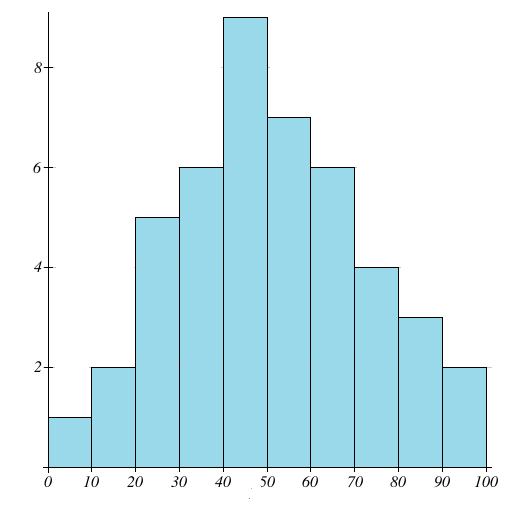
As we can see in the above image, the peak of the histogram is attained at only one class interval, 40 – 50.
Types of Unimodal Histogram:
- If the “peak” of the histogram lies towards the right side, with the “tail” of the histogram towards the left side then we say that the histogram is a left skewed histogram.
- If the “peak” of the histogram lies towards the left side, with the “tail” of the histogram towards the right side then we say that the histogram is a right skewed histogram.
- If the “peak” of the histogram lies exactly at the center, with the data being distributed symmetrically around the mode, then we say that the distribution is symmetric (or we say that the data has no skewness).
Bimodal vs Unimodal Histogram:
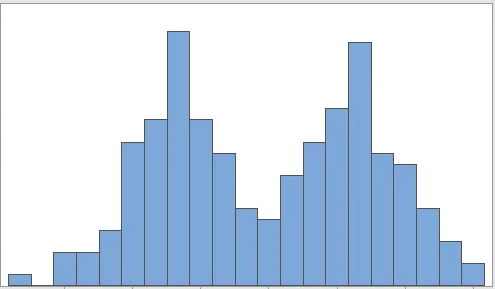
As compared to a unimodal histogram, A bimodal histogram has two “peaks” meaning that it attains local maximum at two different values. A bimodal histogram looks somewhat like as shown in the image below.
Examples of Unimodal Distributions:
- The heights of a particular population generally have a unimodal distribution. There are lesser number of people who are too short of too tall and there is a greater frequency of people who have around average height. The unique mode is attained at this average height of the population.
- The normal distribution is the most famous example of a unimodal distribution. It is shaped in the form of a bell-shaped curve. It is a symmetric distribution where the mean, median and mode are all equal to each other.
