A frequency distribution table is a tabulated form of data consisting of two columns- data values and frequency. When the data values are grouped in the form of class intervals then such a table is known as a grouped frequency distribution table.
The class intervals tell us the range of values that the data takes and the frequency tells us the number of times these values occur in the data.
How to construct Frequency Distribution Table:
We can construct a frequency distribution table by following the method given below in a step-by-step manner.
- Draw a table with two columns. The first column is for the data values and the other table is for writing down the frequency of the data values.
- Write down the data values in the first column.
- For each data value, count the number of times that data value occurs in the data. This is the frequency of the data value.
- Note down the frequency for each data value in the second column corresponding to the frequency.
- Add up all the frequencies in the second column to find N which is the total number of data values
- On the other hand, suppose that we want to construct a grouped frequency distribution table. Given the data in raw form, decide how many classes you want to have.
- Calculate the class width using the formula, Class width = (Largest value-Smallest value)/Number of Intervals.
- Now that class intervals have been constructed, count the number of data occurring in each interval and note it down as the frequency in the second column.
Example:
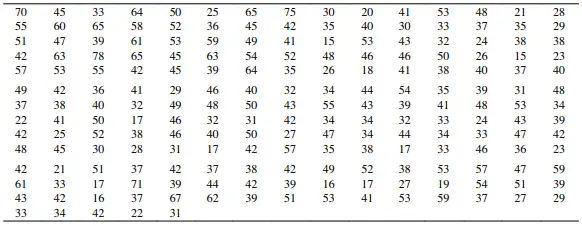
Consider the following set of data values showing the marks obtained by 200 students in an exam. We are given a large number of large number of raw data values as shown in the image below.
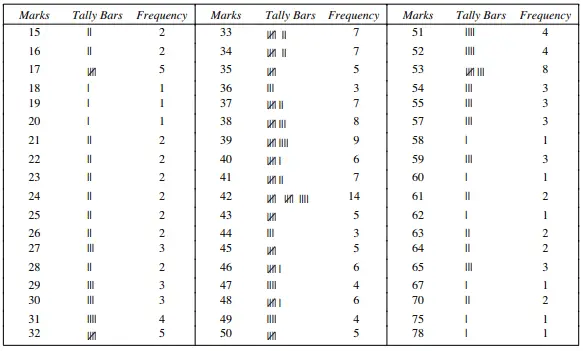
We now represent the data in the form of an ungrouped frequency table as shown below. Since exactly 7 students have received 34 marks in the exam we write 7 in the column corresponding to the frequency. A single bunch of tally marks with a slanting cross corresponds to a total frequency of 5.
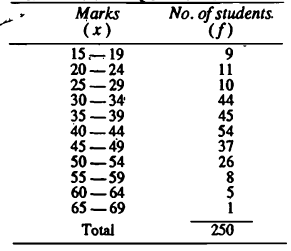
We can further express the data in an even more compact form by expressing the data in the form of class intervals as shown below.
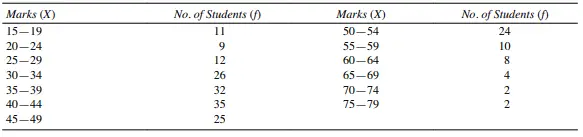
Frequency Distribution Table for Grouped Data:
In a grouped frequency table the data is divided into classes. This makes the data much more compact in terms of presentation.
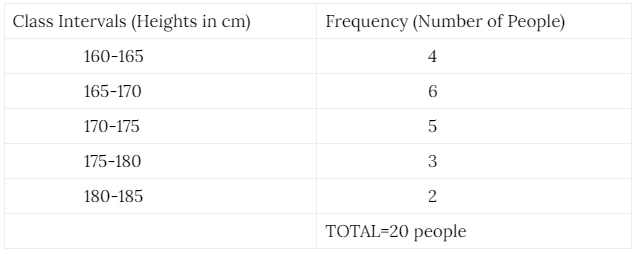
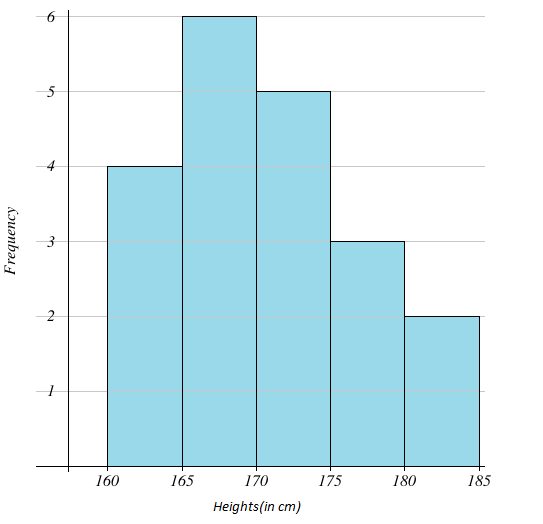
We can use a grouped frequency table to draw a histogram which can help us in visualizing the data. Consider the following frequency distribution about the heights of a group of 20 people.
The frequency histogram looks like this,
Also, by using the frequency distribution we can construct the cumulative frequency table and relative frequency table. Using these we can draw ogives and relative frequency histograms that help us further in data visualization.
Frequency Distribution Table for Ungrouped Data:
If the data is not divided into classes but the frequencies are noted down for each data point then such a tabular presentation of data is known as an ungrouped frequency distribution table.
As an example consider the following ungrouped distribution table. It shows the heights of a group of 40 people along with the corresponding frequency:
| Height (in cm) | Frequencies (Number of people) |
| 167 | 3 |
| 168 | 7 |
| 169 | 12 |
| 170 | 8 |
| 171 | 7 |
| 172 | 8 |
| 173 | 5 |
| N = 40 |
So we can see from the above table, that 8 out of 40 people have a height of exactly 170cm. Here we have not divided the data into classes because the range of values for the height is very small.
We should use grouped distribution when the range of data values is so high that there is no choice but to divide the data into class intervals in order to make the data compact and easy to understand.
What are the advantages of a Frequency Distribution Table?
It happens that many times data is given to us in raw form. The data in the raw form may consist of hundreds or thousands of data points. In that case, it is very hard to make sense of the data because of the sheer volume of data.
Here the advantage of constructing a frequency distribution table is that we can get an idea of how the data is distributed at a glance. Another advantage is that we can use it to construct histograms and bar graphs which help in data visualization.
How to find n in a Frequency Distribution Table?
We can find the value of ‘n’ in the frequency distribution table by adding up all of the frequencies. The ‘n’ in the frequency distribution table refers to the total number of data points in the given data. For example in the above frequency table, N=40 means that we are dealing with the data for a total of 40 people.