In a frequency distribution table, the cumulative frequency means the total of all the frequencies of the current and previous class intervals. The distribution table that is so obtained is called a cumulative frequency distribution table.
For example, given the marks obtained by students and their frequencies, you might want to know the number of students who got less than 30 marks. This would involve adding up the number of students who got marks between 0-10, between 10-20, and between 20-30. This is an example of cumulative frequency.
How to construct the cumulative frequency table?
Step 1: Express the raw data in the form of a frequency distribution table.
Step 2: The cumulative frequency of the first class interval is simply equal to its frequency.
Step 3: To find the cumulative frequency we simply add up the frequencies in the current and previous rows.
Step 4: Alternatively one can find cumulative frequency by adding the current frequency to the previous cumulative frequency.
Step 5: To verify if the calculations made are correct, check that the final cumulative frequency is equal to the total frequency.
Let us try to understand how this can be done by looking at some simple examples.
Example 1:
Consider the following frequency distribution table:
| Class intervals | Frequencies |
| 0-10 | 7 |
| 10-20 | 10 |
| 20-30 | 13 |
| 30-40 | 5 |
| 40-50 | 6 |
| 50-60 | 9 |
| 60-70 | 2 |
In order to obtain the cumulative frequency we simply add up the frequencies in the original and preceding rows.
For example to obtain the third cumulative frequency we add 7+10+13=30.
Following this procedure, we obtain the cumulative frequency distribution table as follows:
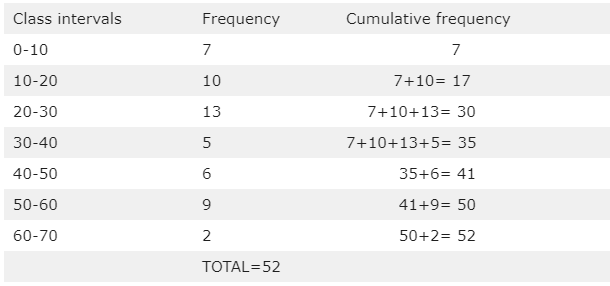
The cumulative frequency can also be found by adding the current frequency and the previous cumulative frequency. For example, in the above table, the cumulative frequency for the class 40-50 is obtained by adding 6 and 35.
Notice that the final cumulative frequency gives us the total frequency (that is the total number of students in the class) which is 52. This makes us sure of the correctness of our calculations.
What is Cumulative Relative Frequency?
Cumulative relative frequency refers to the proportion of data values that are less than or equal to a certain value. It is usually expressed in the form of a percentage.
For example, suppose that in a test of 100 marks the cumulative frequency for 60 marks is 85%. This means that 85% of the students have obtained less than 60 marks in the exam.
The cumulative relative frequency can be represented easily in the form of a cumulative relative frequency table.
How do you find the Cumulative Relative Frequency?
- Represent the data in the form of a frequency distribution table.
- Find the cumulative frequencies by summing up the frequencies of the current and the preceding class intervals.
- Divide the cumulative frequencies by the total frequency. This gives us the cumulative relative frequency.
- If needed, we convert the cumulative relative frequencies obtained above into percentages by multiplying the proportion by 100.
Example 2:
Consider the following data given in the form of a frequency table.
| Class Intervals | Frequency |
| 0-10 | 10 |
| 10-20 | 15 |
| 20-30 | 7 |
| 30-40 | 18 |
We find out the cumulative relative frequency table as follows.
Step 1: We find out the cumulative frequency by adding up the frequencies of the current and previous class intervals.
| Class Intervals | Frequency | Cumulative Frequency |
| 0-10 | 10 | 10 |
| 10-20 | 15 | 10+15 = 25 |
| 20-30 | 7 | 10+15+7 = 32 |
| 30-40 | 18 | 10+15+7+18 = 50 |
| TOTAL = 50 |
Step 2: We find out the relative cumulative frequency by dividing the cumulative frequency by the total frequency.
| Class Intervals | Frequency | Cumulative Frequency | Relative Cumulative Frequency |
| 0-10 | 10 | 10 | 10/50 = 0.2 |
| 10-20 | 15 | 25 | 25/50 = 0.5 |
| 20-30 | 7 | 32 | 32/50 = 0.64 |
| 30-40 | 18 | 50 | 50/50 = 1 |
| Total=50 |
Step 3: We convert the relative cumulative frequency into percentages by multiplying it by 100
| Class Intervals | Frequency | Cumulative Frequency | Relative Cumulative Frequency |
| 0-10 | 10 | 10 | 0.2 or 20% |
| 10-20 | 15 | 25 | 0.5 or 50% |
| 20-30 | 7 | 32 | 0.64 or 64% |
| 30-40 | 18 | 50 | 1 or 100% |
| Total=50 |
Remarks:
1. The cumulative relative frequency for the last class must always be 1 because we are dividing the total frequency by itself to calculate the final cumulative relative frequency.
2. A cumulative relative frequency distribution shows us the percentage of data values that lie below an upper class interval.
3. A cumulative relative frequency graph or a cumulative frequency histogram is drawn in the usual way except for the fact that we plot the cumulative relative frequencies on the Y axis.
What is the Difference between Relative Frequency and Cumulative Frequency?
Relative frequency and cumulative frequency are two different concepts. The relative frequency is obtained by dividing the frequency by the total frequency. It is a ratio that tells us how many times a value occurs in the data set.
On the other hand, cumulative frequency is obtained by summing up all the previous frequencies. It tells us how many values are less than or equal to a fixed value.