A right skewed histogram is a histogram that has a long tail towards the right end of the graph and a peak towards the left.
This means that the smaller values occur in the data with higher frequency and the larger values occur with comparatively lesser frequency.
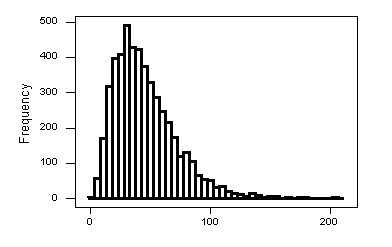
As we see in the above image, values less than 100 have more frequency while the larger values greater than 100 occur relatively less number of times.
The graph has its tail end towards the right and attains a “peak” on the left side.
If a histogram is skewed towards the right, we say that the histogram has positive skewness and that the distribution is positively skewed.
Relationship between Mean, Median, and Mode in a Right Skewed Histogram:
The value where the histogram attains the “peak” is the mode of the distribution. We have the following relationship between the mean, median, and mode.
Mean ≥ Median ≥ Mode.
That is, the mean is greater than the median which is in turn greater than the modal value of the distribution.
Real-Life Example of right-skewed data:
The distribution of wealth amongst the population of a country is an example of data that is skewed towards the right. A large amount of wealth is concentrated in the hands of the very rich who are few in number.
The vast majority of people have comparatively lesser income. If we were to graph the data, the resulting histogram obtained would be skewed towards the right.
Construction of a right skewed histogram:
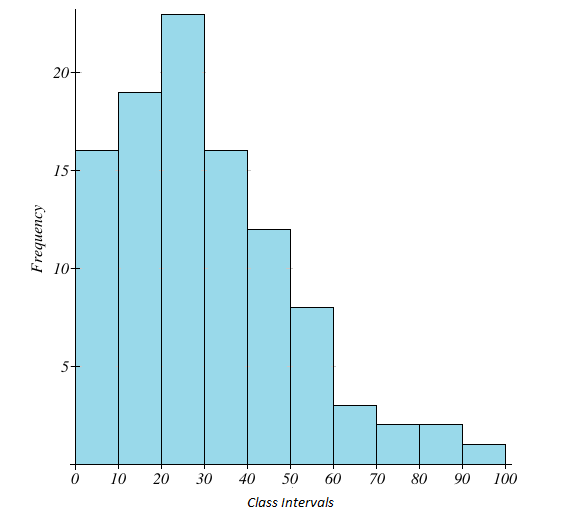
Consider the following data given in the form of a grouped frequency table:
| Class Intervals | Frequency |
| 0-10 | 16 |
| 10-20 | 19 |
| 20-30 | 23 |
| 30-40 | 16 |
| 40-50 | 12 |
| 50-60 | 8 |
| 60-70 | 3 |
| 70-80 | 2 |
| 80-90 | 2 |
| 90-100 | 1 |
We plot the above data and obtain the following right skewed histogram,
Measuring the skewness of the histogram:
We can quantify the skewness of a histogram by means of the following formula,
Skewness = 3*(Mean – Median)/Standard Deviation.
The above formula allows us to compare two different distributions and helps us to decide which one of them has higher skewness. The value of skewness is always positive for a right-skewed distribution.