Stanine scores are standardized scores that express the data in single-digit values which gives us an idea about the distribution of our data. If a point is higher compared to the mean then it is given a stanine score from 6 to 9 and if the data point is lesser compared to the mean it is given a stanine score from 1 to 4.
In all the stanine score takes nine values from one to nine. Here 1 is the lowest score and 9 is the highest stanine score. For example, suppose we are given data about the IQ of students in a class in terms of stanine scores. If a student has a stanine score of 7 it means that the student has above average IQ compared to the rest of the students in the class. A stanine score of 9 would mean that the student has the highest IQ among all the students in the class.
Procedure to find stanine scores/convert data in stanine scores:
- Find the mean µ of the data.
- Calculate the standard deviation σ for the given data.
- Covert the data into Z scores using the formula, Z=(X-µ)/σ
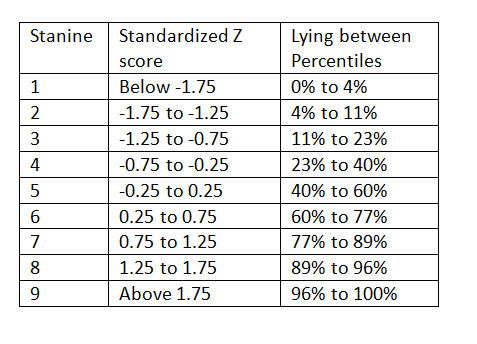
- Replace the Z score value by the corresponding stanine score by using the below table.
Example: We are given the heights of 1000 people living in a particular town. The average height of the people is 168cm with a standard deviation of 3cm. If John has a height of 163cm, express it in the form of a stanine score.
Solution:
Step 1: We note down the mean and standard deviation given as,
µ = 168cm and σ = 3cm
Step 2: Given X = 163cm we convert it to Z score using the formula,
Z=(X-µ)/σ
Z = (163-168)/3 = -1.67
Step 3: Convert the Z score to the stanine scale by looking at the above table.
Hence, Stanine score = 2 which means that John has a much smaller height compared to the average.
