Grubbs test (also called the Maximum Normed Residual Test) is a test used to find outliers in a given set of data. It can detect whether the smallest value or the largest value in the given set of data is an outlier or not.
Note that the Grubbs’ test detects the presence of outliers one at a time. So if you want to test whether two of the smallest values are outliers, you will need to run the test twice.
Also, this test can only be applied if the data is normally distributed since the Grubbs’ test statistic formula is obtained under the assumption that the data is drawn from a normal population.
Grubbs’ Test Statistic Formula:
We calculate the Grubbs’ test statistic to test for the presence of outliers using the formula,
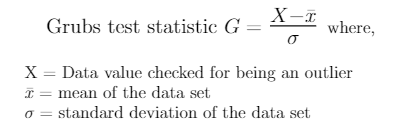
Here, X can be taken to either be the smallest value or the largest value.
Procedure to detect outliers using Grubbs test:
- Arrange the data in ascending order.
- Decide which value (lowest or highest) you want to test for being an outlier.
- Calculate the value of the Grubbs test statistic (denoted as G) using the Grubbs test statistic formula given above.
- Find the critical table value for the given level of significance. You can find critical table values for the Grubbs test here.
- If the value of the Grubbs test statistic exceeds the critical table value we conclude that the given data point is an outlier.
- If the value of the Grubbs test statistic is less than the critical table value we conclude that the given data point is not an outlier.
Example 1:
Check whether the smallest value in the given set of data is an outlier (Take the level of significance α = 5%).
4, 9, 10, 11, 13, 15
Solution: Step 1: We obtain the mean and standard deviation of the data as,
Mean= 10.33
Standard deviation= 3.78
Step 2: Using the Grubbs test statistic formula we get,
G = |4 – 10.33|/3.78 = 1.67
Step 3: From here we see that the critical table value for n=6 is,
Critical value = 1.887
Step 4: Since the test statistic is less than the critical value we conclude that the smallest value is not an outlier.
Example 2:
Check whether the largest value in the given set of data is an outlier. Take the level of significance α = 5%
11, 12, 15, 16, 17, 19, 25
Solution: Step 1: We obtain the mean and standard deviation of the data as,
Mean= 16.43
Standard deviation= 4.69
Step 2: Using the Grubbs test statistic formula we get,
G = |25 – 16.43|/4.69 = 1.827
Step 3: From here we see that the critical table value for n=7 is,
Critical value = 2.019
Step 4: Since the test statistic exceeds the critical value we conclude that the largest value is an outlier.
Other methods to find outliers:
Some other tests used to detect the presence of outliers are:
- The 1.5 IQR rule uses the inter-quartile range to detect outliers.
- We can also use Dixon’s Q test to detect the presence of outliers.
- We can identify outliers visually by drawing scatterplots.
