The Dixons Q test is a test that we use to identify the outliers in our data. This test is applied when the sample size is small. The data set is generally considered to be small if it has less than 10 observations.
Dixons Q test identifies whether the smallest or largest data value is an outlier or not. By applying this test consecutively we can identify all the outliers in our data.
It is important to note that Dixon’s q test does not identify all the outliers at once but does it a single step at a time.
So if you want to test whether the second smallest value is an outlier or not you need to first test for the smallest value. You can only test for the second smallest value after the smallest value is rejected as an outlier.
Procedure to Carry out the Dixons Q test:
1) Arrange the data in order from lowest to highest.
2) Find the range of the data by subtracting the lowest value from the highest value.
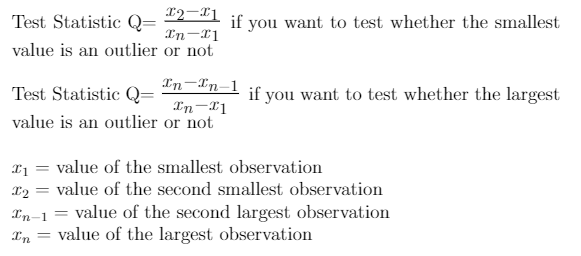
3) If you want to test whether the smallest value is an outlier then calculate the Q statistic using the formula,
Qstat= Difference between smallest and second smallest value/Range
4) If you want to test whether the largest value is an outlier then calculate the Q statistic using the formula,
Qstat= Difference between highest and second highest value/Range
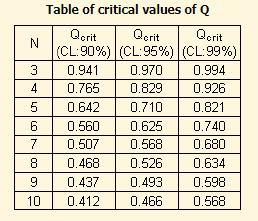
5) Find the Q-table value from the Q-table below at the given level of significance.
6) If the Q statistic has a value greater than the table value then we reject the corresponding data point as an outlier.
Example:
Consider the following set of data. Test if the smallest value is an outlier at a 5% level of significance.
33,35,47,49,53,56
Solution: Here n=6 therefore data size is small and we may apply the Dixons Q test.
Step 1: The range of the data is 56-33=23.
Step 2: Since we want to test the smallest value the Q statistic is given by the formula,
Qstat= Difference between smallest and second smallest value/Range
= 35-33/23 = 2/23 = 0.08696
Step 3: From the above table, the Q table value at 95% confidence level is Q-table = 0.625.
Step 4: Since the Q statistic has a value lesser than the table value, we conclude the smallest data point 33 is not an outlier.