The graph of the function y=1/x consists of two pieces. As the value of x approaches infinity we see that y tends more and more towards 0. Similarly, for large values of y, the value of x is very small and approaches closer and closer towards zero.
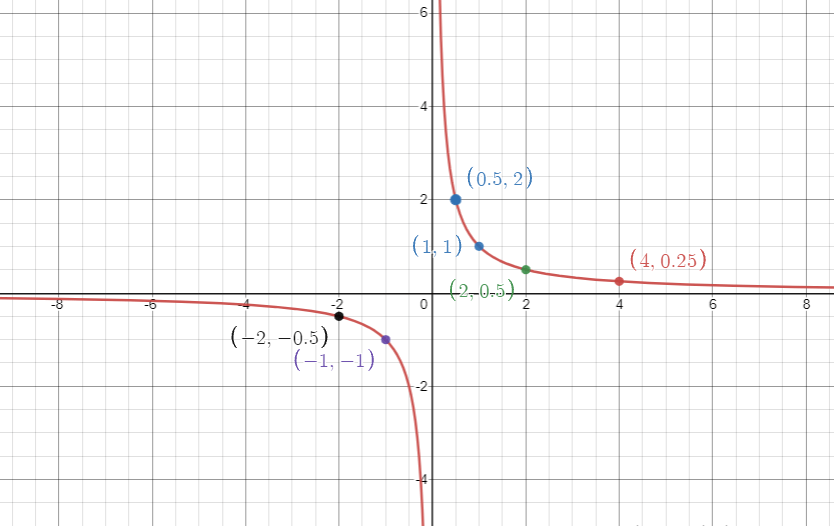
Some points on the graph of the function are:
| X | Y = 1/X | Point = (X,Y) |
| 4 | 1/4 = 0.25 | (4,0.25) |
| 2 | 0.5 | (2,0.5) |
| 1 | 1 | (1,1) |
| 1/2 = 0.5 | 2 | (0.5,2) |
| -1 | -1 | (-1,-1) |
| -2 | -0.5 | (-2,-0,5) |
The x-axis and the y-axis are known as the “asymptotes” for the graph. This is because the graph of the function slowly approaches closer and closer to the x-axis and the y-axis but never actually touches the x-axis or the y-axis.
The graph is symmetric about the origin and the two “pieces” of the graph are mirror images of each other. The shape of the graph is called a “rectangular hyperbola”.