The graph of the function x=-3 is a vertical straight line parallel to the y-axis that passes through the point (-3,0). The graph of the function looks like,
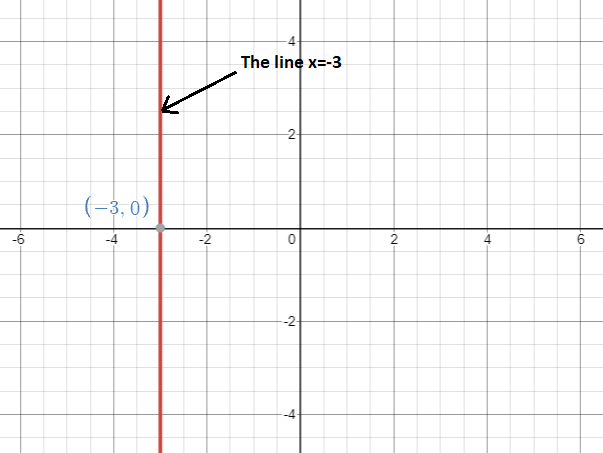
The line meets the x-axis at the point (-3,0) and hence the x-intercept of the graph is -3. Since the line does not meet the y-axis it does not have a y-intercept. The graph is completely vertical which implies that the slope of the graph is infinity/undefined.
Graphing x=a:
The example seen above is a special case of a more general situation. Suppose that you want to draw the graph of the function x=a. Then the graph will similarly be a vertical line parallel to the y-axis and passing through the point (a,0). Let us look at a few more examples.
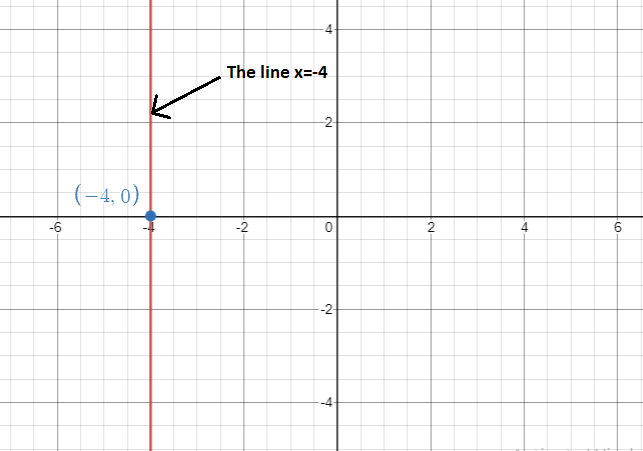
Graph x=-4
The graph of the function x=-4 looks like,
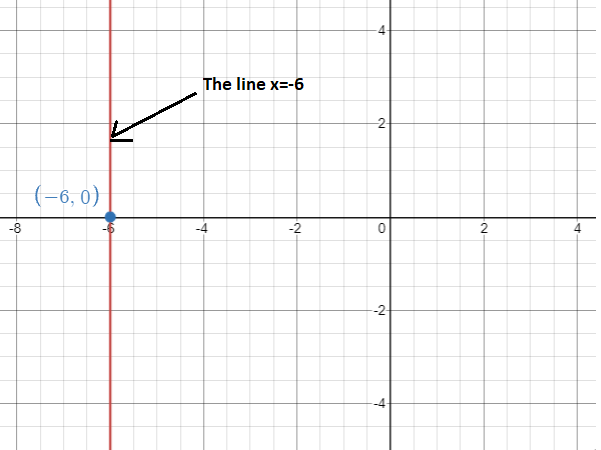
Graph x=-6
The graph of the function x=-6 looks like,
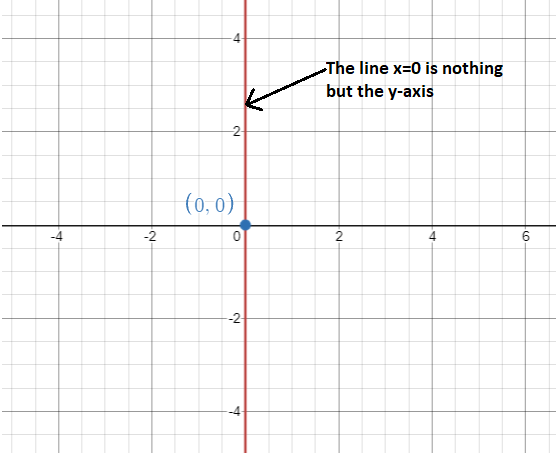
Graph x=0
This is nothing but the vertical line passing through the origin (0,0). It is in fact the y-axis of our graph,
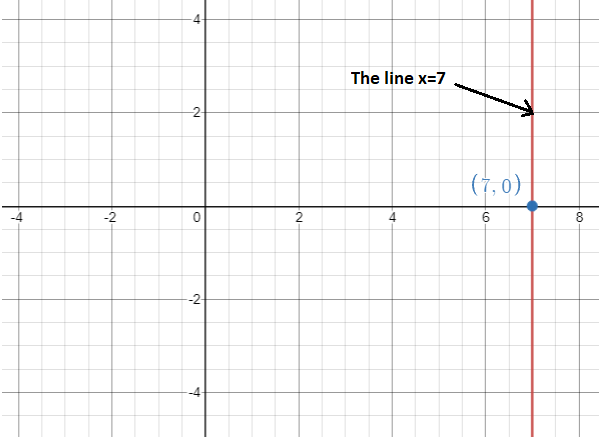
How to graph x=7
In order to draw the graph of x=7, we locate the point (7,0) on the graph and draw a vertical line passing through it parallel to the y-axis.