The adjusted R square value is a numerical value that measures the explanatory power of a linear regression model.
The value of the adjusted R square always lies between 0 and 1. The closer the value is toward 1, the greater the predictive power of our model.
R square vs Adjusted R square:
When we construct a regression model we calculate the R square value (coefficient of determination) which tells us how much the dependent variable depends on the explanatory variables.
The difference between the R square and the adjusted R square is that the adjusted R square is a more accurate reflection of the true explanatory power of our model.
This is because the R square considers all possible explanatory variables that you have added to the model even though some of them might not be significant.
The adjusted R square value takes into consideration the number of explanatory variables in our model. It reduces the R square value by removing the variation due to the variables that are not significant.
Interpretation of Adjusted R square:
If the adjusted R square value lies between 0.7 and 1 then it means that the model is a “good” one and that there is a strong correlation between the dependent and the independent variables.
On the other hand, if the adjusted R square value lies between 0 and 0.4 then it means that the model is not a good one. In such a case we should remove the unnecessary variables and add significant independent variables.
How to calculate adjusted R square?
The formula for calculating adjusted R square is as follows,
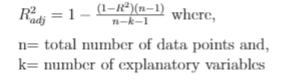
Example:
Suppose we have a regression model with 20 explanatory variables and a total of 1000 data points. If the value of the R square is 0.9 then calculate the value of the adjusted R square.
Solution: Given, n=1000, k=20, and R2=0.9.
Substituting all this in the above formula we get,
R2adj = 1 – (0.1*999/979) = 0.89
Since the difference between R square and adjusted R square is very less we see that all of the explanatory variables are significant