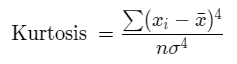
The Kurtosis of a given set of data values can be calculated using the formula,
Kurtosis = ∑(Xi – X̅)4/nσ4.
- X̅ denotes the mean.
- σ denotes the standard deviation.
The Kurtosis of distribution gives us some idea about the shape of the distribution. Depending on the value of the Kurtosis we can classify our data as leptokurtic, mesokurtic, and platykurtic.
Example 1: Kurtosis for Ungrouped Data
Consider the following set of ungrouped data values.
23, 34, 38, 47, 59, 63, 84.
We first calculate the values of the mean and the standard deviation.
Mean X̅ = ∑Xi/n = (23+34+38+47+59+63+84)/7= 348/7 = 49.7143.
| Xi | (Xi – X̅) | (Xi – X̅)2 | (Xi – X̅)3 | (Xi – X̅)4 |
| (Xi – 49.7143) | (Xi – 49.7143)2 | (Xi – 49.7143)3 | (Xi – 49.7143)4 | |
| 23 | -26.714 | 713.653 | -19065 | 509301 |
| 34 | -15.714 | 246.939 | -3880.5 | 60978.8 |
| 38 | -11.714 | 137.225 | -1607.5 | 18830.6 |
| 47 | -2.7143 | 7.3673 | -19.997 | 54.2778 |
| 59 | 9.2857 | 86.2245 | 800.656 | 7434.66 |
| 63 | 13.2857 | 176.51 | 2345.06 | 31155.9 |
| 84 | 34.2857 | 1175.51 | 40303.2 | 1381824 |
| TOTAL = 348 | TOTAL = 0 | TOTAL = 2543.43 | TOTAL = 18876.2 | TOTAL = 2009579 |
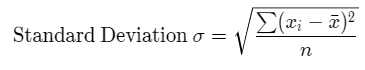
Standard Deviation σ =√(∑(Xi – X̅)2/n) = √(2543.3/7)= 19.0617.
We now calculate the Kurtosis using the formula,
Kurtosis = ∑(Xi – X̅)4/nσ4 = 2009579/(7*19.06174) = 2.1745.
Example 2: Grouped Data Kurtosis Calculation
Consider the following set of data values given in the form of a grouped frequency distribution table.
| Class Intervals | Frequency |
| 0-5 | 2 |
| 5-10 | 3 |
| 10-15 | 1 |
| 15-20 | 4 |
| 20-25 | 5 |
| 25-30 | 9 |
| 30-35 | 6 |
| 35-40 | 12 |
| 40-45 | 8 |
| 45-50 | 7 |
We calculate the values required to calculate the mean and the standard deviation,
| Classes | Class Mark Xi | fi | fi*Xi | (Xi-X̅) | fi(Xi-X̅)2 | fi(Xi-X̅)4 |
| 0 – 5 | 2.5 | 2 | 5 | -28.86 | 1665.76 | 1387376 |
| 5-10 | 7.5 | 3 | 22.5 | -23.86 | 1707.85 | 972249 |
| 10-15 | 12.5 | 1 | 12.5 | -18.86 | 355.686 | 126513 |
| 15 – 20 | 17.5 | 4 | 70 | -13.86 | 768.36 | 147594 |
| 20 – 25 | 22.5 | 5 | 112.5 | -8.8596 | 392.467 | 30806.1 |
| 25 – 30 | 27.5 | 9 | 247.5 | -3.8596 | 134.072 | 1997.26 |
| 30 – 35 | 32.5 | 6 | 195 | 1.1404 | 7.8024 | 10.1462 |
| 35 – 40 | 37.5 | 12 | 450 | 6.1404 | 452.447 | 17059 |
| 40 – 45 | 42.5 | 8 | 340 | 11.1404 | 992.859 | 123221 |
| 45 – 50 | 47.5 | 7 | 332.5 | 16.1404 | 1823.58 | 475062 |
| n=57 | ∑fiXi=1787.5 | TOTAL=0 | ∑fi(Xi-X̅)2 =8300.877 | ∑fi(Xi-X̅)4 =3281887 |
Mean = ∑fiXi/∑fi = ∑fiXi/n = 1787.5/57 = 31.3596.
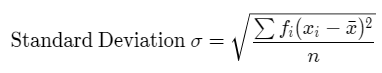
Standard Deviation σ =√(∑fi(Xi – X̅)2/n) = √(8300.877/57)= 12.0677.
The formula for calculating kurtosis for a set of grouped data values is as follows,
Kurtosis = ∑fi(Xi – X̅)4/nσ4 = 3281887.0786/(57*12.06774) = 2.7149.