The coefficient of the range is a number that tells us about the “spread” of the data. If the coefficient of the range is high it means that the data is “spread apart” and there is high variation in the data values whereas if it is low then it means that the data points are clustered close to each other.
Range and Coefficient of Range:
The range of the data is the difference between the highest and lowest values of the data. The range clearly gives us some idea about the degree of dispersion of the data.
The disadvantage of the range as a measure of dispersion is that when comparing two different data sets, we cannot conclude which one has a higher variation/spread by simply looking at the ranges of the respective data sets.
We need a relative measure of dispersion for comparing the “spread” of two different data sets. This relative measure of dispersion is precisely the coefficient of range. When comparing two data sets, the set whose value of the coefficient is closer to 1 is said to have a higher degree of variation.
Coefficient of Range Formula:
The coefficient of range can be calculated using the formula,
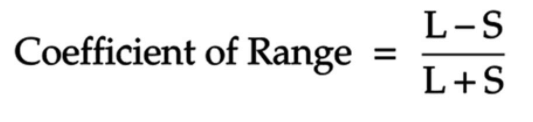
where L is the largest value of the data set and S is the smallest value of the data set. The numerator of the above formula is nothing but the range of the data.
Since the denominator is always greater than the numerator in the above formula, we see that the value of the coefficient of the range is always less than or equal to 1.
Example:
Compute the coefficient of range for the two data sets below and find out which of the two has a greater degree of dispersion/spread:
First Data Set: 2, 2, 2, 2, 2, 3, 5, 6, 7, 7.
Second Data Set: 2, 3, 4, 5, 7, 9, 11, 13, 15, 18
For the First Data Set:
We calculate the coefficient using the above formula,
Coefficient of Range = (L-S)/(L+S) = (7-2)/(7+2) = 0.5556.
For the Second Data Set:
Coefficient of Range = (L-S)/(L+S) = (18-2)/(18+2) = 0.8.
Since the value of the coefficient of the second data set is closer to 1, we conclude that the second data set has a higher degree of dispersion compared to the first.