In this article, we explain the main differences between the T distribution and the Z distribution.
1. Number of Parameters:
The normal distribution has two parameters – the mean and the variance. The standard normal Z distribution has a mean of 1 and a variance of 0.
The T distribution on the other hand only has a single parameter known as its degrees of freedom.
Each of the T distributions differs from any other t-distribution by an associated quantity that is called degrees of freedom, commonly denoted as df. This quantity, df, is always an integer number, i.e., a whole positive number.
2. The Shape of the Distribution:
The Z distribution had a shape similar to that of a bell-shaped curve. Note that the normal distribution is always symmetric.
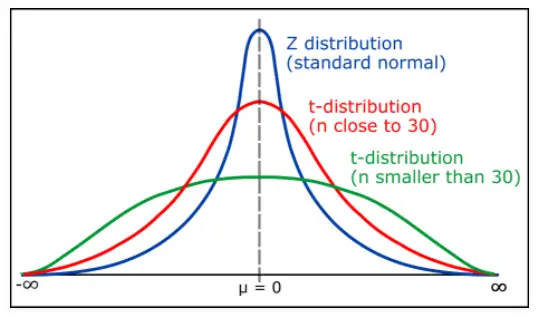
The shape of the T distribution depends on the number of subjects studied, i.e., on the number of subjects in the sample.
Another property of the t-distribution is that its shape approaches the standard normal distribution with increasing degrees of freedom.
The probability density function (pdf) of the t-distribution is somewhat flatter and ‘‘shorter’’ than that of the standard normal.
A characteristic property of the t-distribution is that its tails are thicker than those of the standard normal distribution, and thus it rises to a lower level.
3. Use of the Distribution:
Both distributions are used when testing the value of the population mean for any given population.
The difference is that the Z test is used when the population standard deviation is known whereas the T distribution is used when the population parameter is unknown.
Also, the T distribution is generally used when the sample size is small (less than 30) whereas the Z distribution is used if the sample size is large (more than 30).