Drawing a scatterplot is the simplest way of the diagrammatic representation of bivariate data. For a bivariate distribution (x,y) if the values of the variables X and Y are plotted along the x-axis and y-axis respectively in the XY plane, the diagram of dots so obtained is known as the scatter diagram. In this article, we explain some of the advantages and disadvantages of scatter diagrams.
Advantages of Scatter Diagrams:
- Scatter diagrams are very easy to plot since we only need to locate and mark some points on a piece of graph paper.
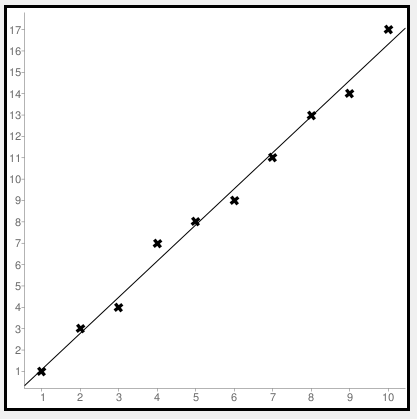
- Scatter diagrams are easy to understand and interpret. If there is an upward trend rising from the lower left-hand corner and going upward to the upper right-hand corner, the correlation is positive since this reveals that the values of the two variables move in the same direction. If, on the other hand, the points depict a downward trend from the upper left-hand corner to the lower right-hand corner, the correlation is negative since in this case, the values of the two variables move in the opposite directions.
- Outliers are isolated and do not affect the results. If a point is very far away from where the majority of points are concentrated then that point can simply be ignored for the purposes of correlation analysis.
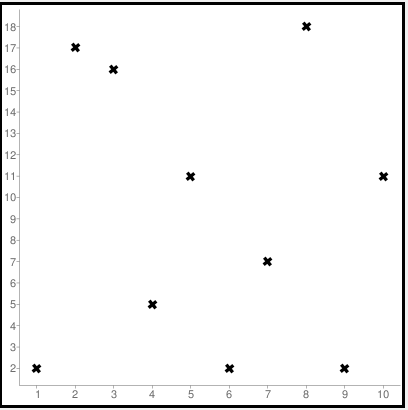
- A Scatter diagram helps in determining how strongly two variables are related and predicts the behavior of the dependent variable as a measure of the independent variable. If the points are very dense i.e., very close to each other, a fairly good amount of correlation may be expected between the two variables. On the other hand, if the points are widely scattered, a poor correlation may be expected between them.
- This diagram is especially useful when one variable is easy to measure and the other is not.
- The scatter diagram enables us to obtain an approximate estimating line or line of best fit by the free hand method. The method generally consists in stretching a piece of thread through the plotted points to locate the best possible line.
Disadvantages of Scatter Diagrams:
- It only depicts the direction but not the degree of correlation. We cannot say if the degree of correlation between the two variables is 0.7 or 0.8 merely by looking at the scatter diagrams. We need to calculate the coefficient of correlation in order to get an accurate value for the degree of correlations
- This method is useful only if there are a small number of data points. if there are too many points to be plotted then the scatter diagram becomes too cluttered and unreadable. It is impossible to draw any conclusion in such cases.
- This diagram does not show the relationship for more than two variables. When dealing with three or more variables we need to calculate the partial correlation coefficients in order to understand the relationship between the variables.
References:
- Business Statistics – SC Gupta
- Basics In Nursing Research and Biostatistics – Sreevani Rentala