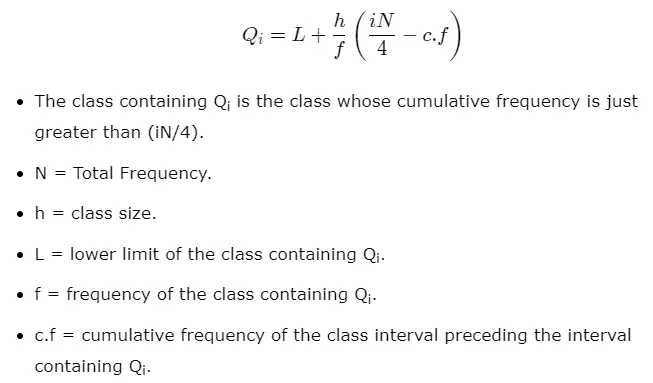
The quartiles for grouped data can be calculated using the formula,
Qi = L + h/f*(iN/4 – c.f).
- The class containing Qi is the class whose cumulative frequency is just greater than (iN/4).
- N = Total Frequency.
- h = class size.
- L = lower limit of the class containing Qi.
- f = frequency of the class containing Qi.
- c.f = cumulative frequency of the class interval preceding the interval containing Qi.
The three quartiles are numerical values that divide the given data into four equal parts.
The lower quartile, the median, and the upper quartile divide the data at the one-fourth, one-half, and three-fourths values respectively. They are denoted by the symbols Q1, Q2, and Q3.
Steps to find Quartiles for Grouped Data:
- Find the value of N, by adding up all the frequencies.
- Calculate the less than cumulative frequencies for all class intervals.
- Calculate the value of (iN/4) in order to find the ith quartile (i = 1, 2, or 3).
- The quartile is contained in the class whose cumulative frequency is just greater than (iN/4).
- Calculate the value of the ith quartile by using the formula given below.
Example 1:
Calculate the upper quartile Q3 for the following grouped frequency distribution:
| Class Interval | Frequency |
| 0-10 | 4 |
| 10-20 | 7 |
| 20-30 | 2 |
| 30-40 | 5 |
| 40-50 | 12 |
Solution: Since we want to calculate Q3 we have that i=3 in the above formula.
We first calculate the less than cumulative frequencies by adding up the current and preceding frequencies of a class interval.
| Class Interval | Frequency | Cumulative Frequency |
| 0-10 | 4 | 4 |
| 10-20 | 7 | 4+7 = 11 |
| 20-30 | 2 | 4+7+2 = 13 |
| 30-40 | 5 | 4+7+2+5 = 18 |
| 40-50 | 2 | 4+7+2+5+2 = 20 |
| N = 20 |
Now, since i=3 we have that (iN/4) = (3*20/4) = 15.
The value of cumulative frequency just greater than 15 is 18.
Therefore, Q3 lies in the class interval 30-40. Here, L = 30, f = 5, h =10 and c.f = 13.
We substitute all these values in the above formula.
Q3 = L + h/f*(3N/4 – c.f).
Q3 = 30 + 10/5*(3*20/4 – 13).
Q3 = 30 + 2*(15 – 13) = 30 +4 =34.
Example 2:
Calculate the lower quartile Q1 for the following grouped frequency distribution:
| Class Interval | Frequency |
| 0-5 | 5 |
| 5-10 | 10 |
| 10-15 | 7 |
| 15-20 | 3 |
| 20-25 | 3 |
Solution: Since we want to calculate Q1 we have that i=1 in the above formula.
| Class Interval | Frequency | Cumulative Frequency |
| 0-5 | 5 | 5 |
| 5-10 | 10 | 15 |
| 10-15 | 7 | 22 |
| 15-20 | 3 | 25 |
| 20-25 | 3 | 28 |
| N = 28 |
Now, since i=1, we have that (iN/4) = (1*28/4) = 7.
The value of cumulative frequency just greater than 7 is 15. Therefore, Q3 lies in the class interval 5-10.
Here, L = 5, f = 10, h =5 and c.f = 5. We substitute all these values in the formula.
Q1 = L + h/f*(N/4 – c.f).
Q1 = 5 + 5/10*(28/4 – 5).
Q1 = 5 + 1/2*(7-5) = 5+1 =6.
Therefore the value of the lower quartile is 6.
Calculating Quartiles Graphically:
- Draw a cumulative frequency curve by plotting the values of observations or class intervals along the horizontal scale (i.e. x-axis) and cumulative frequency along the vertical scale (i.e., y-axis).
- Determine the quartile value, that is, the value of (in/4)th observation (i = 1, 2, 3), where n is the total number of observations in the data set.
- Locate this value on the y-axis and from this point draw a line parallel to the x-axis meeting the ogive at a point, say P. Draw a perpendicular on the x-axis from P and it meets the x-axis at the point, say M. Then M is the required value of the quartiles.
Example:
Consider the data given in the form of a grouped frequency distribution as follows:
| Class Interval | Frequency |
| Below 875 | 69 |
| 875 – 950 | 167 |
| 950 –1025 | 207 |
| 1025 –1100 | 65 |
| 1100 – 1175 | 58 |
| 1175 – 1250 | 24 |
| 1250 – 1325 | 10 |
We first calculate the cumulative frequencies by adding each frequency value with the preceding frequencies.
| Class Interval | Frequency | Cumulative Frequency |
| Below 875 | 69 | 69 |
| 875 – 950 | 167 | 236 |
| 950 –1025 | 207 | 443 |
| 1025 –1100 | 65 | 508 |
| 1100 – 1175 | 58 | 566 |
| 1175 – 1250 | 24 | 590 |
| 1250 – 1325 | 10 | 600 |
| N = 600 |
Let us calculate the value of the second quartile, that is, the median. We have that,
Second Quartile = (iN/4)th term = (2*600/4)th term = 300th term.
We now construct the cumulative frequency curve (ogive) and locate the second quartile as follows.
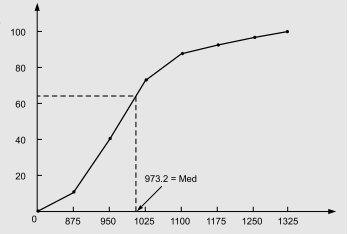
Therefore the value of the second quartile is 973.2