An ogive is a graphic presentation of the cumulative frequency (c.f.) distribution of a continuous variable. It consists in plotting the cumulative frequency (along the Y-axis) against the class boundaries (along X-axis). Since there are two types of cumulative frequency distributions viz., ‘less than’ c.f. and ‘more than’ c.f. we have accordingly two types of ogives. We now list some of the advantages and disadvantages of ogives in statistics.
Advantages of Ogive:
- These graphs can be used to visually represent the total values that lie above or below a specified upper-class boundary. It outlines each interval in the frequency distribution and depicts the proportion of data points above or below a particular value
- It differentiates rates of change between classes better than other graphs. The point-to-point relative slopes indicate the magnitude of the increase. A steeper slope indicates a greater increase when compared to a gradual slope.
- The end value of the cumulative frequency is equal to the total number of data values, as all the frequencies have already been added up to the previous total.
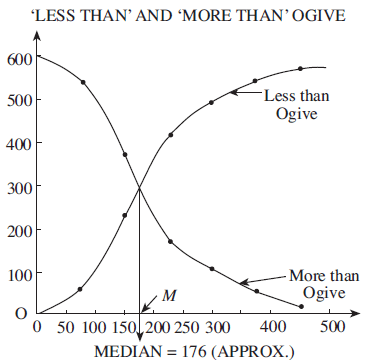
- We may draw both the ‘less than’ ogive and ‘more than’ ogive on the same graph. If done so, they intersect at a point. The foot of the perpendicular from their point of intersection on the X-axis gives the value of the median.
- Ogives are particularly useful for the graphic computation of partition values, viz., Median, Quartiles, Deciles, Percentiles, etc. They can also be used to determine graphically the number or proportion of observations.
- Ogives can be used with an advantage over frequency curves for a comparative study of two or more distributions because like frequency curves, for each of the distributions different ogives can be constructed on the same graph and they are generally less overlapping than the corresponding frequency curves.
Disadvantages of Ogive:
- It is very complicated to prepare. To plot an ogive it is necessary to have a frequency table, class boundaries, and cumulative frequencies. We need to calculate the cumulative frequencies by adding up the correct frequencies. For grouped data, an ogive is formed by plotting the cumulative frequency against the upper boundary of the class and for ungrouped data, cumulative frequency is plotted on the y-axis against the data which is on the x-axis.
- Does not reflect all data points. This is because only the class boundaries are plotted on the X-axis. The values in between are not used in order to construct the ogive.
- Does not reveal much about central tendency and dispersion. It also does not reveal much about the skewness and kurtosis of the data.
References:
- Business Statistics – SC Gupta and Indra Gupta.
- Basics in Nursing Research and Biostatistics – Sreevani Rentala.