The Lorenz curve is a way to graphically visualize the distribution of incomes in a population. The symbol L(p) denotes the percentage of the total income that is earned by the bottom ‘p’ percentage of people.
For example, L(90%) = 20% means that the bottom 90% of the population earns only 20% of the total income. We plot the values of p on the x-axis and the corresponding values of L(p) on the y-axis in order to plot the Lorenz curve.
How to construct the Lorenz Curve:
Suppose that we want to plot the Lorenz curve for the incomes for five people A, B, C, D, and E. Their monthly incomes (in thousand dollars) are given to be as follows:
5, 7, 9, 17, 22
Solution: We construct the Lorenz curve as follows,
Step 1: Person A represents one-fifth that is, 20% of the total population.
The total income is 5+7+9+17+22= 60
Out of this, the monthly income of person A is 5. So the proportion of the income of the bottom 20% of the population is 5/60 = 8.34%
So, L(20%) = 8.34%
Step 2: A and B represent two-fifths that is, 40% of the total population.
The monthly income made by persons A and B together is 5+7=12. So the proportion of the income of the bottom 40% of the population is 12/60 = 20%
So, L(40%) = 20%
Step 3: Similarly we calculate that,
L(60%)= 35%
L(80%)= 63.34%
L(100%)= 100%
Step 4: We now plot the values of p and L(p) and obtain the Lorenz curve as follows,
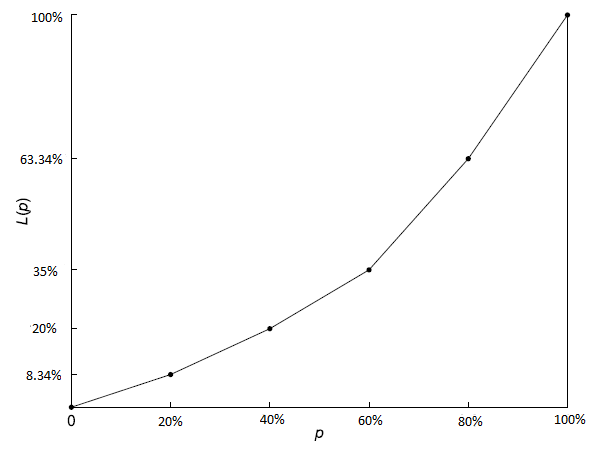
Remark: We can use proportions instead of percentages when plotting the data on the x-axis and y-axis.
Interpretation of the Lorenz Curve:
If the wealth had been distributed equally among all of the people then the shape of the Lorenz curve would be an exact straight line. The Lorenz curve being straight means that the incomes are evenly distributed among the entire population.
If the Lorenz curve is farther away from the straight line then it indicates the presence of income inequality in the population. The greater the “gap” in the area between the straight line and the Lorenz curve (shaded region below), the more severe is the income inequality.
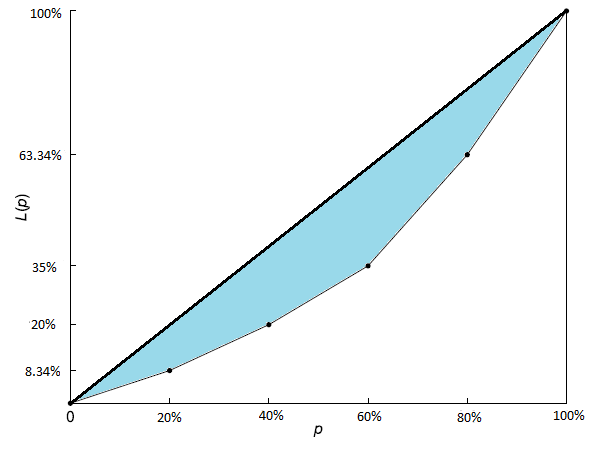
Lorenz Curve and Gini Coefficient:
The Gini coefficient quantifies the degree of the income inequality observed in the Lorenz curve. It is equal to twice the shaded area between the Lorenz curve and the straight line.
It can also be calculated using the formula,
Gini coefficient = 1 – 2B where,
B is the area under the Lorenz curve.
References:
Introduction to Probability and Statistics for Engineers and Scientists – Sheldon M. Ross