A fractile is a point such that a specified proportion of the data lies below that point. Since a particular fraction of the data lies below that point, the point is known as the fractile.
For example, the median is a ½ fractile (half point fractile) since half of the data values lie below the median. This is because the median sits at the exact centre of the data dividing it into two equal parts.
Notation:
The fractile is denoted using the symbol Xp where ‘p’ is the corresponding proportion/fraction of data values that lie below that point. The value of ‘p’ always lies between 0 and 1.
For example, X0.5 is the median (here p = ½) because half of the data values lie below the median.
Fractiles in Probability Density Curve:
The fractile Xp (corresponding to the fraction ‘p’) is the point on the probability distribution curve such that an area of proportion ‘p’ lies below that point and the remaining area under the curve of proportion ‘1-p’ lies above.
Fractiles to the right of the median are called upper fractiles and fractiles below the median are called lower fractiles.
The familiar points such as median, quartiles, deciles, and percentiles are all fractiles for a certain proportion p. For example, the 39th percentile is the fractile X39 because 39% of the data values lie below the 39th percentile.
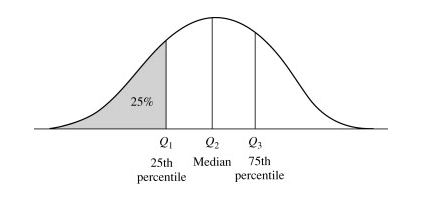
The lower quartile Q1 is the fractile corresponding to the proportion 0.25 because 25% of the area under the curve lies below the lower quartile.