The class width of a histogram refers to the thickness of each of the bars in the given histogram. The histogram can have either equal or unequal class widths. If the histogram has equal class widths then each of the bars has the same thickness. if the bars have different thicknesses it means that the histogram has unequal class intervals.
Let us understand both situations by looking at some examples.
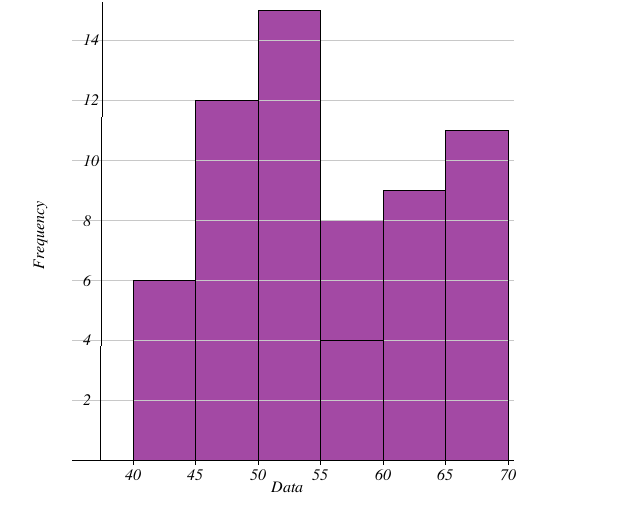
Example 1: Equal Class Widths
Consider the following set of data given in the tabular form.
| Class Intervals | Frequency |
| 40-45 | 6 |
| 45-50 | 12 |
| 50-55 | 15 |
| 55-60 | 4 |
| 60-65 | 9 |
| 65-70 | 11 |
In the above table, we see that each of the class intervals has an equal length of 10. Thus the bars in the histogram have equal width as shown below:
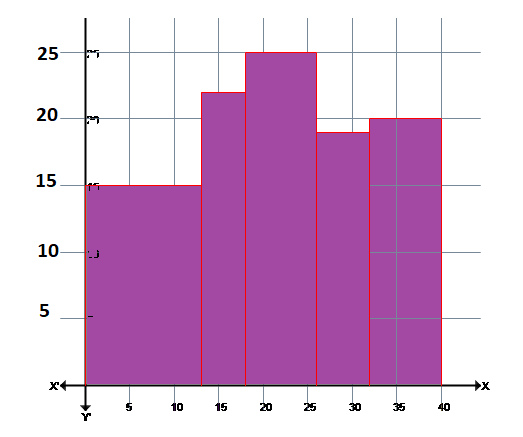
Example 2: Unequal Class Widths
Consider the following set of data given in the tabular form.
| Class Intervals | Frequency |
| 0-13 | 15 |
| 13-18 | 22 |
| 18-26 | 25 |
| 26-32 | 19 |
| 32-40 | 20 |
In the above table, we see that each of the first class intervals has a length of 13, the second class interval has a width of 5, the third class interval has a width of 8, and so on. As expected the bars in the histogram have unequal width as shown below: