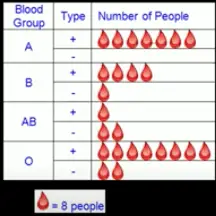
As is evident from its name, Pictograph is a type of graph that represents data using images, symbols or icons. Sometimes, each image or symbol represents a count of more than one, which is shared using a scale. For example, the below pictograph from Khan Academy has a scale of eight, wherein each blood drop represents eight people.
Advantages of Pictographs:
Easy to read: Since images, objects or symbols are used to represent numbers, pictographs are very easy to read. Reading a pictograph also comes intuitively & does not require much effort to read.
Universally understandable: Pictographs are used globally, crossing language and cultural barriers as they do not require exhaustive explanation for making sense of them.
Efficient Teaching Tool: Since pictographs are visually heavy, they function as a good introduction on teaching children how to read and make sense of data.
Compression Capability: If the data is big and cannot be represented by assigning a single value to each object, the scale of each object can be increased. For example, the below pictograph uses a scale of eight to display more information in less space.
Disadvantages of Pictographs:
Lack of fractional representation: We cannot represent fractional values using pictographs. Only positive integers can be represented using pictographs.
Not ideal for large datasets: When the data to be represented is huge or complex, pictograph might not be the best way to display it as pictorial representation could be confusing for some people.
Not useful for business settings: Since pictographs are very basic, they might not be ideal to represent and communicate data in formal business settings.
Contextual Challenges: If pictographs are used to display larger datasets but the scale isn’t mentioned, the understanding of presented data could be wrong.