The H test (or Kruskal-Wallis test) is a non-parametric test that is used to test for the equality of three or more population medians. It is the non-parametric version of the usual one-way ANOVA procedure.
Consider the following example. Suppose we divide a group of students into 3 groups and each of the groups is taught using three different teaching methods.
Then we note down the marks obtained by the students in a standardized exam. The Kruskal Wallis H test is used to check whether there is any difference in median marks obtained by students in the three groups.
How to carry out Kruskal-Wallis H test?
1. Arrange the data values from all groups from lowest to highest.
2. Assign ranks to the above data.
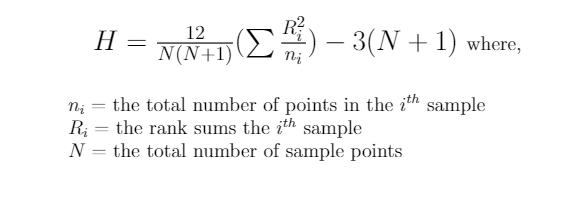
3. Calculate the value of the H statistic using the formula below.
4. Find the critical value from the Chi-square table for (k-1) degrees of freedom at a 5% level of significance. (Here k is the number of groups).
5. If the value of the H statistic is more than the table value we reject the null hypothesis and conclude there is a significant difference between population medians.
6. If the value of the H statistic is less than the table value we accept the null hypothesis and conclude there is no significant difference between population medians.
Example:
Suppose we divide a group of students into 3 groups and each of the groups is taught using three different teaching methods. Then we note down the marks obtained by the students in a standardized exam.
Group A: 80, 83, 79
Group B: 74, 60, 82
Group C: 95, 68, 84
Test the null hypothesis using Kruskal-Wallis H test.
Solution: We define the null hypothesis to be that there is no significant difference between the median marks in all three groups.
Now we arrange the data from lowest to highest and assign ranks.
| Marks | 60 | 68 | 74 | 79 | 80 | 82 | 83 | 84 | 95 |
| Rank | 1 | 2 | 3 | 4 | 5 | 6 | 7 | 8 | 9 |
| Group | B | C | B | A | A | B | A | C | C |
Then R1 = Sum of ranks of group A = 4+5+7 = 16
R2 = Sum of ranks of group B = 1+3+6 = 10
R3 = Sum of ranks of group C = 2+8+9 = 19
And, n1 = n2 = n3 = 3 and N = 3+3+3 = 9
Substituting all this in the above formula we get,
H = (12/90)*(162/3 + 102/3 + 192/3) – 3*10 = 2.756
And Critical Chi-square value (2 degrees of freedom, 5% level of significance) = 5.991 (obtained from Chi-square table)
Since the value of test statistic H is less than the table value we accept the null hypothesis and conclude that there is a significant difference between the three teaching methods.