Kurtosis tells us how our data is spread around the tails of the distribution compared to the center relative to the normal distribution. It describes the shape of our data.
Kurtosis gives us an understanding of the form and type of the hump (middle part) of a frequency distribution, whereas skewness helps in distinguishing the right or left tails of the frequency curve. Kurtosis is concerned with whether the frequency curve is peaked or flat.
Definition of Kurtosis:
Many variables that we may try to measure turn out to be “normally” distributed. For example, if you might try to measure the height of everyone in your city the frequency distribution would look somewhat like this.
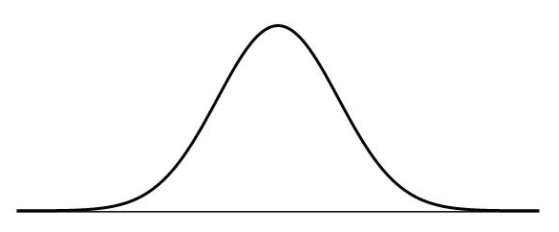
We would have a large number of people in the middle with average heights and a comparatively lesser number of people who are either extremely tall or extremely short. The bell-shaped curve above is also known as the normal frequency distribution.
As it turns out in many situations our variable may not turn out to be normally distributed. For example, the returns of our investment in the stock market may not be distributed normally. In such situations, we would like to know how our data is spread.
Types Of Kurtosis:
Depending on the spread and shape of the data we classify it into three types: Mesokurtic, Leptokurtic, and Platykurtic.
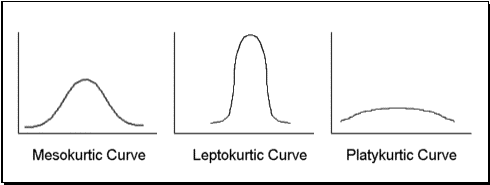
Normal curves are defined as curves that are neither flat nor peaked, and the shape of their hump is taken to be a standard one. Mesokurtic curves are those that have humps that resemble a normal curve and are said to have a normal kurtosis.
Leptokurtic curves, which have higher peaks than the usual curve, are described as having a negative kurtosis. Curves that are flatter than the normal curve are referred to as platykurtic and are said to have excess kurtosis or positive kurtosis.
Mesokurtic Distributions:
If the peak and spread of the distribution is the same as the normal distribution then the distribution is said to be mesokurtic. If the kurtosis is equal to 3 we say that our distribution is mesokurtic.
The normal distribution always has kurtosis equal to 3. So if our data has kurtosis 3 it means our data has a spread similar to that of the normal distribution. The frequency distribution is neither “flat” nor “peaked”.
Leptokurtic Distributions:
Leptokurtic distributions are more “peaked” compared to the normal distribution. If the kurtosis is greater than 3 we say that the distribution is leptokurtic. The data is concentrated more towards the center with almost flat extremes.
The shape of the distribution looks like a thin peaked mountain. We say that such distributions have low kurtosis risk. This is because if our returns on an investment were distributed leptokurtically there would be a lesser chance of a loss (but also a lesser chance of extremely high gains).
Platykurtic Distributions:
A platykurtic distribution has a flatter peak compared to the normal distribution. If the kurtosis is less than 3 we say that the distribution is platykurtic. The data is concentrated more towards the extremes with an almost flat center.
The shape of the distribution looks like a plateau with an almost flat peak. We say that such distributions have a high kurtosis risk. This is because if our returns on investment were platykurtic there would be a higher chance of a loss (but also a higher chance of extremely high gains).
In short, kurtosis is important because it tells us about the shape of our distribution and how it is spread in the tail ends as compared to the center.
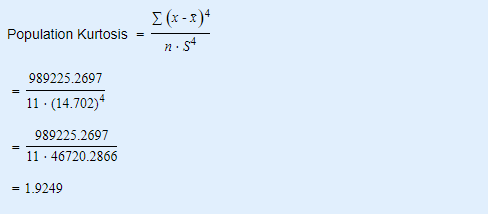
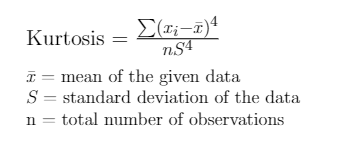
Kurtosis Formula:
The Kurtosis can be calculated using the formula,
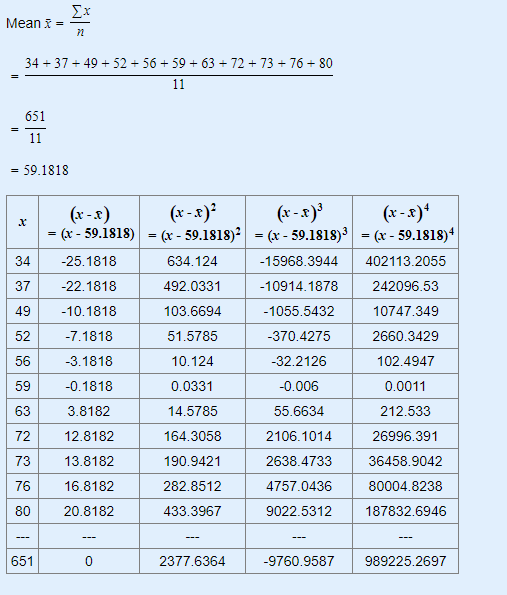
Example: Consider the following set of data values:
34, 37, 49, 52, 56, 59, 63, 72, 73, 76, 80.
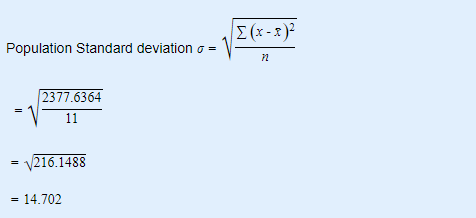
We can calculate the kurtosis in three steps as shown below.