Univariate Analysis in statistics refers to the study of data belonging to one category only. “Uni” means one and “variate” means variable hence univariate analysis stands for the statistical study of single-variable data.
On the other hand, if we were interested in two or more different variables and the relationships between them, then such as study would be called multivariate analysis.
Some examples of univariate analysis:
- Suppose we are given data about the IQ of students in a particular school. We might be interested in finding the average IQ. This is an example of univariate analysis since we are dealing with only one variable, that is, IQ of the students.
- Suppose we are given data about the monthly incomes of American households. Then finding the median income is an example of univariate analysis.
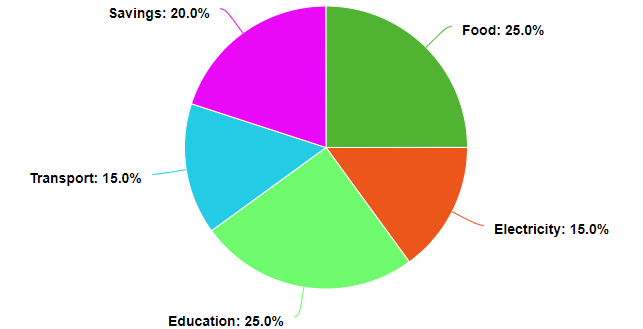
- Suppose you draw a pie chart depicting the house budget showing the expenditure for food, electricity, etc. This is once again an example of univariate analysis since we are dealing with only one variable – Money spent.
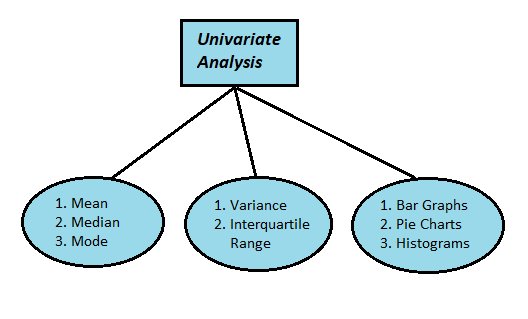
Techniques for univariate analysis/How to study univariate data?
There are many techniques available to study single variable data. Some of them are:
- Covert the data in raw form to the form of a grouped frequency table. This makes the data much easier to grasp.
- Find the central value of the data by calculating things like the mean, median, and mode for the data. This will express the univariate data in the form of a single data point making the data much easier to grasp.
- Find the measures of dispersion like the variance, coefficient of variation and inter-quartile range to get an idea about the spread of the data.
- Visualize the data by drawing graphs such as bar graphs, histograms, pie charts, ogives, etc.
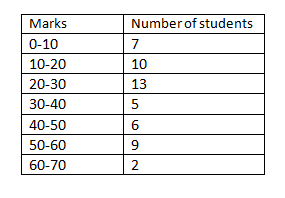
Some examples of univariate data:
1) Consider the following data about the marks obtained by students in an exam. Here the single variable under study is the marks obtained.
2) The pie chart below showing the budget of a family in visual form is another example of univariate data.
Univariate Analysis vs Multivariate Analysis:
As opposed to univariate analysis where we are interested in studying only one variable, in multivariate analysis, we want to study the relationships between two or more variables.
For example, suppose you want to study the relationship between the two variables- “Time Spent in Studying” vs “Marks Obtained in an Exam”. We can find the correlation coefficient between the two variables to understand the relationship between them.
We can also construct a linear regression model to make predictions about the value of the dependent variable. Techniques like ANOVA, ANCOVA, etc. are also applied in the study of multivariate data.