Tally Marks are used to represent the frequency with which a particular value occurs in a given set of data. A single occurrence of a data value is represented by one vertical stroke. So four vertical strokes means that that data value occurs four times in the data. If the frequency of the data value is 5, we draw a slanting line across the four vertical lines. Let us understand this by means of an example.

In the above example, the value 15 occurs five times and therefore it is represented by 5 tally marks. Notice that when drawing 5 tally marks we do not draw 5 vertical lines. The fifth line is drawn across the four vertical lines creating a single packet. A packet of 5 tally marks represents a frequency of 5. In order to draw 6 tally marks, we draw a packet of 5 tally marks and draw another vertical line adjacent to it. This can be seen in the above example for the data value 19.
Let us look at another example that will clarify the definition of tally marks.

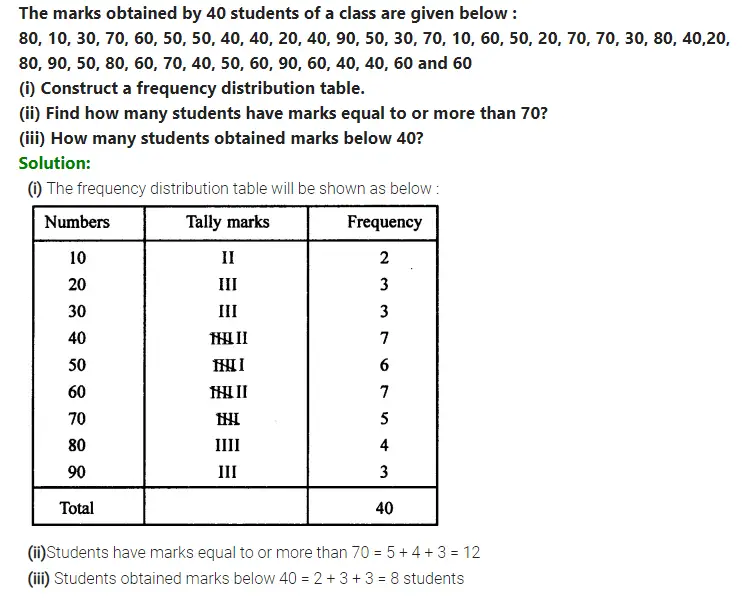
When the frequencies of the data are presented in tabular form by using tally marks, the table is known as a tally mark chart. The tables seen in the above two examples are tally mark charts.
How to make tally marks in word?
In order to draw a single vertical stroke in MS Word, press the “pipe” key on the keyboard. On English PC and Mac keyboards, the pipe is on the same key as the backslash key. It is located above the Enter key (Return key) and below the Backspace key. Pressing and holding down the Shift while pressing the | creates a pipe. In order to draw a line across four vertical lines, first, select the four vertical lines and then press Ctrl+D.