A relative frequency polygon is a frequency polygon where we plot the relative frequencies instead of the actual frequencies on the Y-axis. The data values are plotted along the X-axis as in the usual frequency polygon.
Steps to Construct a Relative Frequency Polygon:
- We first calculate the relative frequecies corresponding to each data value.
- Find the sum of all the frequencies and denote it as N.
- Divide each frequency by the total frequency(N) in order to find the corresponding relative frequencies.
- In order to express the relative frequencies in percentage, multiply them by 100.
- Plot the values taken by the variable on the X-axis and the corresponding relative frequencies on the Y-axis.
- The frequency curve can be obtained by drawing a smooth freehand curve through the vertices of the frequency polygon.
Example:
Let us construct a relative frequency polygon for the given set of data:
| Data Values (X) | Frequency |
| 12 | 23 |
| 13 | 30 |
| 14 | 7 |
| 15 | 11 |
| 16 | 9 |
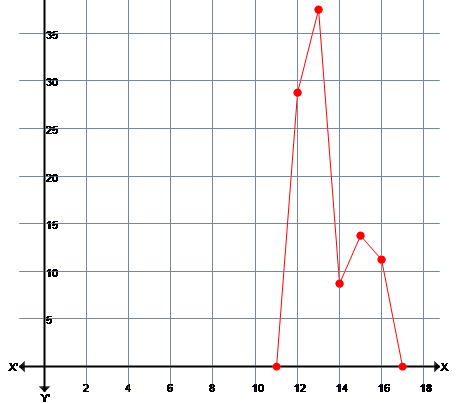
We first calculate the total frequency(N) using which we find the relative frequency in percentage form.
| Data Values (X) | Frequency | Relative Frequency |
| 12 | 23 | 23/80 *100 = 28.75% |
| 13 | 30 | 30/80 *100 = 37.5% |
| 14 | 7 | 7/80 *100 = 8.75% |
| 15 | 11 | 11/80 *100 = 13.75% |
| 16 | 9 | 9/80 *100 = 11.25% |
| Total Frequency N=80 |
The relative frequency curve for the above set of data values looks like,
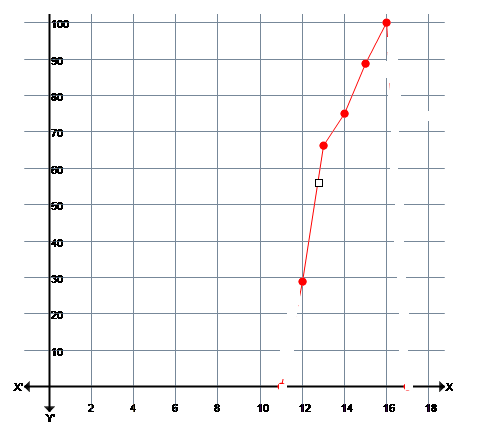
Cumulative Relative Frequency Polygon:
In order to construct a cumulative relative frequency polygon, we plot the cumulative relative frequencies on the X-axis. The cumulative relative frequencies can be obtained by summing up the current relative frequency with the preceding relative frequencies. For example, we can find the cumulative relative frequency for the above set of data as follows:
| Data Values (X) | Frequency | Relative Frequency | Cumulative Relative Frequency |
| 12 | 23 | 23/80 *100 = 28.75% | 28.75% |
| 13 | 30 | 30/80 *100 = 37.5% | 28.75%+37.5%=66.25% |
| 14 | 7 | 7/80 *100 = 8.75% | 28.75%+37.5%+8.75%=75% |
| 15 | 11 | 11/80 *100 = 13.75% | 88.75% |
| 16 | 9 | 9/80 *100 = 11.25% | 100% |
| Total Frequency N=80 |
The cumulative relative frequency curve for the above data values looks like,