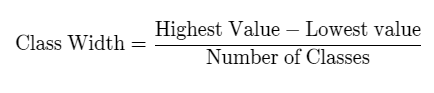
The class width for a set of data values can be calculated using the formula,
Class Width = (Highest Value – Lowest value)/Number of Classes.
The class width of a given frequency distribution refers to the length of the class intervals of the distribution.
Therefore, the class width is indeed the same as the class size. It is sometimes also called the class length.
Class Width Formula
Suppose that we are given a set of raw data values. The class width for a set of data values can be calculated using the formula,
How to Determine Class Width
- Find the range of the data by subtracting the lowest value from the highest value.
- Divide the result by the number of classes for the data.
- Round up the answer to obtain the number of classes.
Example
Suppose we are given the following set of data values:
15, 44, 40, 53, 77, 76, 94, 86, 53, 18, 46, 74, 48, 36, 84, 15, 37, 47, 24, 29.
Let us assume that we want to have 8 classes. We have that,
Number of classes = 8.
Highest value = 94
Lowest value = 15
Class Width = (Highest Value – Lowest value)/Number of Classes.
Class Width = (94 – 15)/8 = 9.9 ≈ 10.
So we should take the class width to be equal to 10.
- Since the lowest value is 15, the class intervals begin with 15 and increase in steps of 10.
- We can then calculate the various frequencies. For example, since there are four values 15, 18, 15, and 24 lying in the first interval, we put 4 in the first row under the frequency column.
| Class Intervals | Frequencies |
| 15-25 | 4 |
| 25-35 | |
| 35-45 | |
| 45-55 | |
| 55-65 | |
| 65-75 | |
| 75-85 | |
| 85-95 |
On counting all of the frequencies we obtain the desired class intervals and their frequencies.
| Class Intervals | Frequencies |
| 15-25 | 4 |
| 25-35 | 1 |
| 35-45 | 4 |
| 45-55 | 5 |
| 55-65 | 0 |
| 65-75 | 1 |
| 75-85 | 3 |
| 85-95 | 2 |
Relationship between Class Width and Number of Intervals:
When constructing a frequency distribution, as the number of classes is decreased, the class width increases.
The reason behind the increase in class length is that more and more values have to be accommodated inside a small number of classes.
For example, if we divide 100 data values into 4 classes, we would have 4 classes each of length 25. But, if 100 was partitioned into 10 class intervals, we would have 10 class intervals each of length 10.
The size of the class interval is inversely proportional to the number of classes (class intervals) in a given distribution.
Further Reading:
- What is the Class Width for a Histogram? (with Examples).
- Class Midpoint/Class Mark.
- Class Width Calculator.